GenCast in Nature: AI ensemble forecasts, and what they mean for wind power
GenCast, published in Nature, beat ECMWF's ensemble on 97.2% of 1,320 targets and forecast regional wind power better. A summary with the authors' caveats.
AI weather models · Probabilistic forecasting · Wind energy · Research notes
TL;DR
- GenCast, from Google DeepMind, generates ensembles of 15-day global forecasts at 0.25° resolution; one forecast takes about 8 minutes on a single Cloud TPU v5 device.
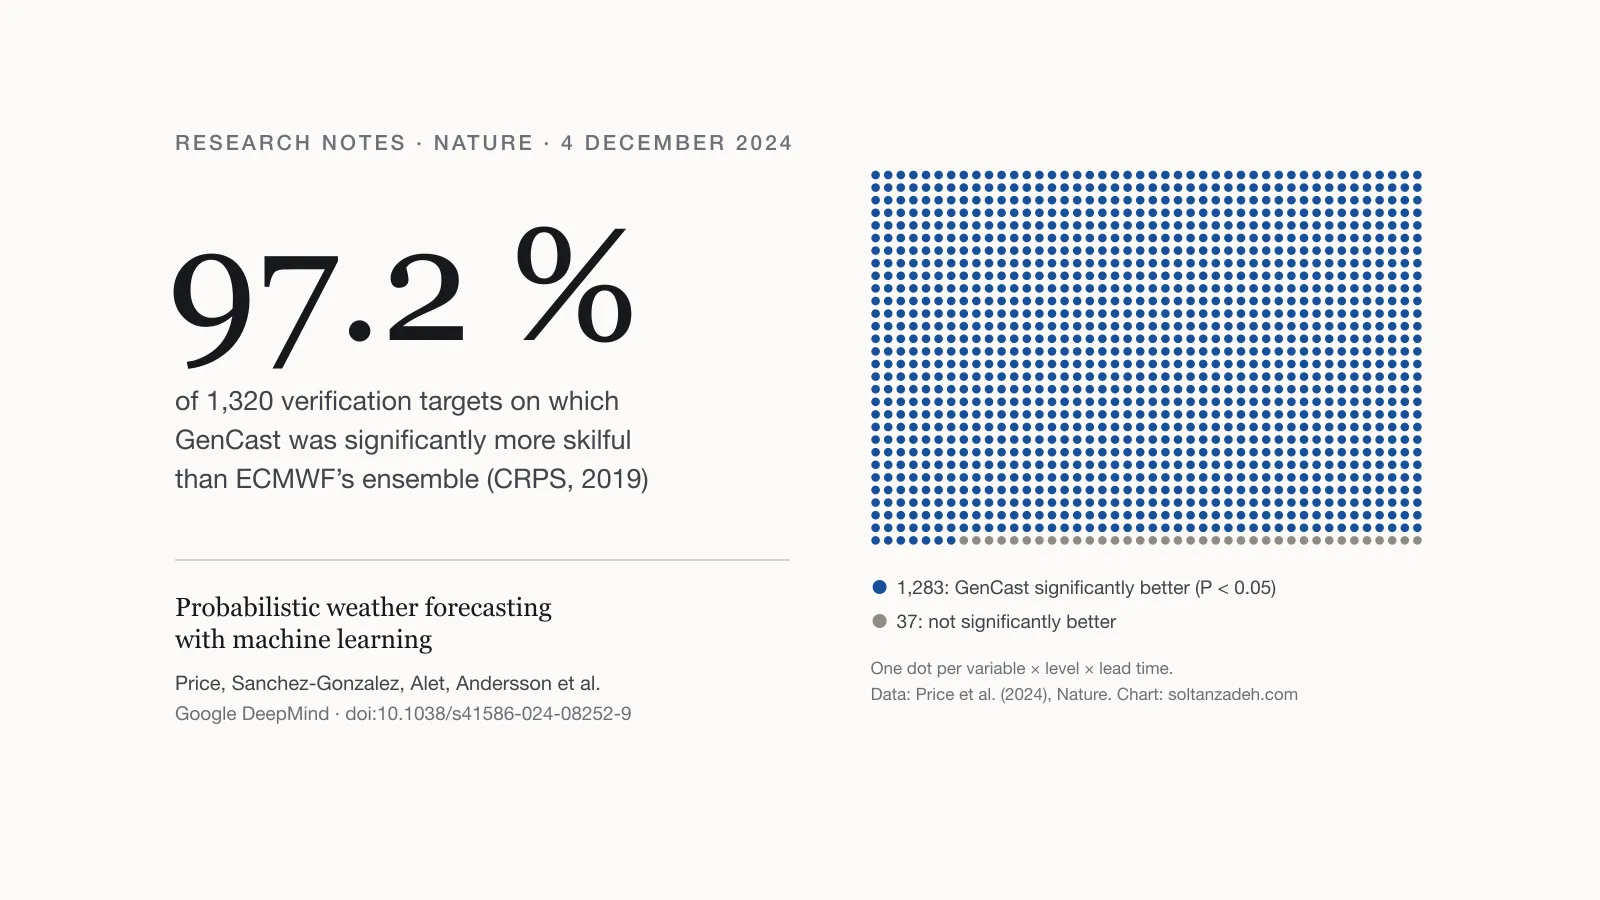
- Tested on 2019, it was significantly more skilful than ECMWF’s ensemble (ENS) on 97.2 % of 1,320 targets, and on 99.6 % of targets beyond 36 hours. It also better predicted extremes and cyclone tracks.
- In a simplified test at 5,344 wind farm locations, its regional wind power forecasts beat ENS by about 20 % up to two days ahead, with significant gains out to seven days.
What was published
On 4 December 2024, Nature published GenCast by Ilan Price and colleagues at Google DeepMind. In July 2023 I summarised Pangu-Weather, a deterministic model. The GenCast authors note that AI models had so far focused mainly on single, deterministic forecasts that do not represent uncertainty, and remained less accurate and reliable than physics-based ensembles; they name one exception, the hybrid NeuralGCM, which is competitive with operational ensembles at a coarser 1.4° resolution. They present GenCast as, to their knowledge, the first machine-learning method to significantly outperform ENS, which they call the top operational medium-range forecast in the world.
How the model works
GenCast is a diffusion model, the type of generative model behind many recent image and video generators. It starts each step from random noise and refines it into a weather state, conditioned on the two previous states. Different noise gives a different, realistic forecast trajectory, so repeating the process produces an ensemble.
It forecasts more than 80 variables in 12-hour steps for 15 days. It was trained on ERA5 reanalysis from 1979 to 2018 and tested on 2019, with 50 members to match the 50 perturbed members of ENS. Each system was verified against its own analysis.
The results
- Skill. Significantly better continuous ranked probability scores (CRPS) than ENS on 97.2 % of the 1,320 combinations of variable, level and lead time (cover image). The largest gains were often at lead times up to about three to five days, for surface variables and for temperature and specific humidity at higher pressure levels, where CRPS was 10 % to 30 % better. The ensemble mean was as accurate as or more accurate than that of ENS on 96 % of targets, and significantly more accurate (RMSE) on 78 %.
- Calibration. Similar to ENS, with spread/skill ratios very close to 1.
- Extremes. Better predictions of exceedances of extreme percentiles of 2 m temperature and 10 m wind, and of extremely low temperature and pressure, at almost all lead times.
- Spatial structure. Better CRPS than ENS on 98.1 % (average-pooled) and 97.6 % (max-pooled) of 5,400 targets pooled over regions, with larger gains at larger scales.
- Cyclones. Ensemble-mean tracks gave about 12 hours of extra accuracy between one and four days ahead, and track-probability forecasts gave better relative economic value than ENS wherever either beat climatology.
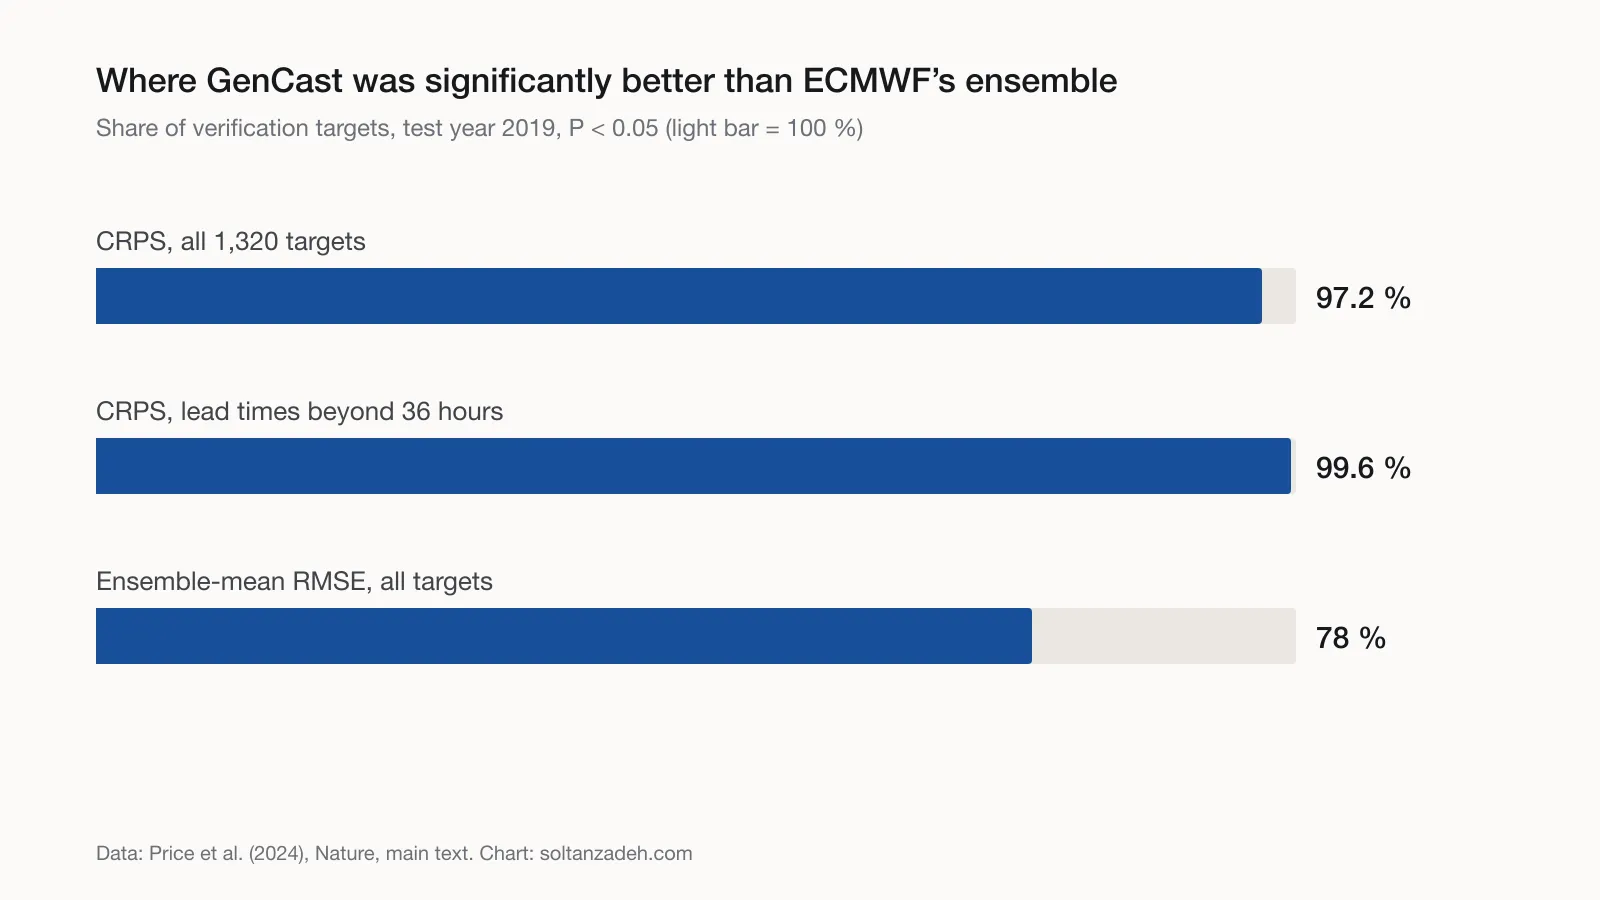
Share of targets on which GenCast was significantly better than ENS (P < 0.05), 2019. Values from Price et al. (2024); chart drawn for this post.
The wind power test
The authors interpolated 10 m wind speed to the 5,344 wind farm locations in the Global Power Plant Database, converted it to power with a standard idealised power curve and each farm’s capacity, and summed the output over regions of 120, 240 and 480 km. Aggregated output tests whether a model captures how wind at nearby farms varies together. GenCast’s CRPS was about 20 % better than that of ENS up to two days ahead and 10 % to 20 % better from two to four days, with significant gains out to seven days.
The authors stress that the test is simplified: it uses 10 m winds although most turbines are closer to 100 m above the ground, and it ignores curtailment for non-weather reasons, such as turbine maintenance, and grid topology.
The authors’ caveats
- The 1,320 targets are not independent forecast tasks, because weather variables are linked; the authors note that such scorecards are nonetheless a standard summary.
- The ENS forecasts used for comparison are from 2019, regridded from ENS’s native resolution at the time (0.2°) to 0.25°. ENS has run at 0.1° since mid-2023, which GenCast at 0.25° does not yet match.
- As a diffusion model it needs more computation than an equivalent deterministic machine-learning model, because each 12-hour step takes 39 evaluations of its denoising network.
- It still depends on conventional data assimilation for its training and starting data.
- Precipitation was left out of the main results because of doubts about ERA5 precipitation.
- Scores were computed against analyses, which is standard practice but does not reward representing uncertainty in the starting conditions. Both systems were compared as raw output, and post-processing could improve either.
My view
The wind power experiment is the part I find most relevant: how uncertain the total output of a group of farms is depends on capturing how wind varies together across sites, which a per-site score does not show. Given the authors’ own caveats, it is an encouraging indication rather than an operational result. The code and model weights are published, so others can test the result against real generation data.
References
- Price, I., Sanchez-Gonzalez, A., Alet, F., Andersson, T. R., El-Kadi, A., Masters, D., Ewalds, T., Stott, J., Mohamed, S., Battaglia, P., Lam, R. and Willson, M. (2024). Probabilistic weather forecasting with machine learning. Nature, published online 4 December 2024. doi:10.1038/s41586-024-08252-9. Open access under CC BY 4.0.
- Code and weights: github.com/google-deepmind/graphcast (doi:10.5281/zenodo.14261754), as listed in the paper’s code availability statement.
- Bi, K. et al. (2023). Accurate medium-range global weather forecasting with 3D neural networks. Nature, 619, 533–538. doi:10.1038/s41586-023-06185-3.
- Kochkov, D. et al. (2024). Neural general circulation models for weather and climate. Nature, 632, 1060–1066. doi:10.1038/s41586-024-07744-y.
Charts are drawn for this post from numbers stated in, or derived from, the paper’s text (1,283 is 97.2 % of 1,320; 37 is the remainder); they are not reproductions of the paper’s figures.
The views in this article are my own and do not represent those of my employer or of any organisation I am associated with.
New articles by email
A short brief whenever I publish.
The key points of each new article and a link to read it in full, about once a month. No tracking; unsubscribe at any time.
You’ll get a confirmation link first. See the privacy notice.
