MeteoSignal: an independent check of AI weather models, at weather stations and against ERA5
MeteoSignal tracks ECMWF's AI model AIFS against IFS, GFS and five more AI models, at stations across Europe and against ERA5, with AI-ready data.
AI weather models · Forecast verification · Open data · MeteoSignal
TL;DR
- MeteoSignal is a free, non-commercial website I built to track how accurate AI weather models are, at weather stations across Europe and against the ERA5 reanalysis. The main model it tracks is ECMWF’s AIFS, compared with the physics-based IFS and GFS; five more AI models are scored as well.
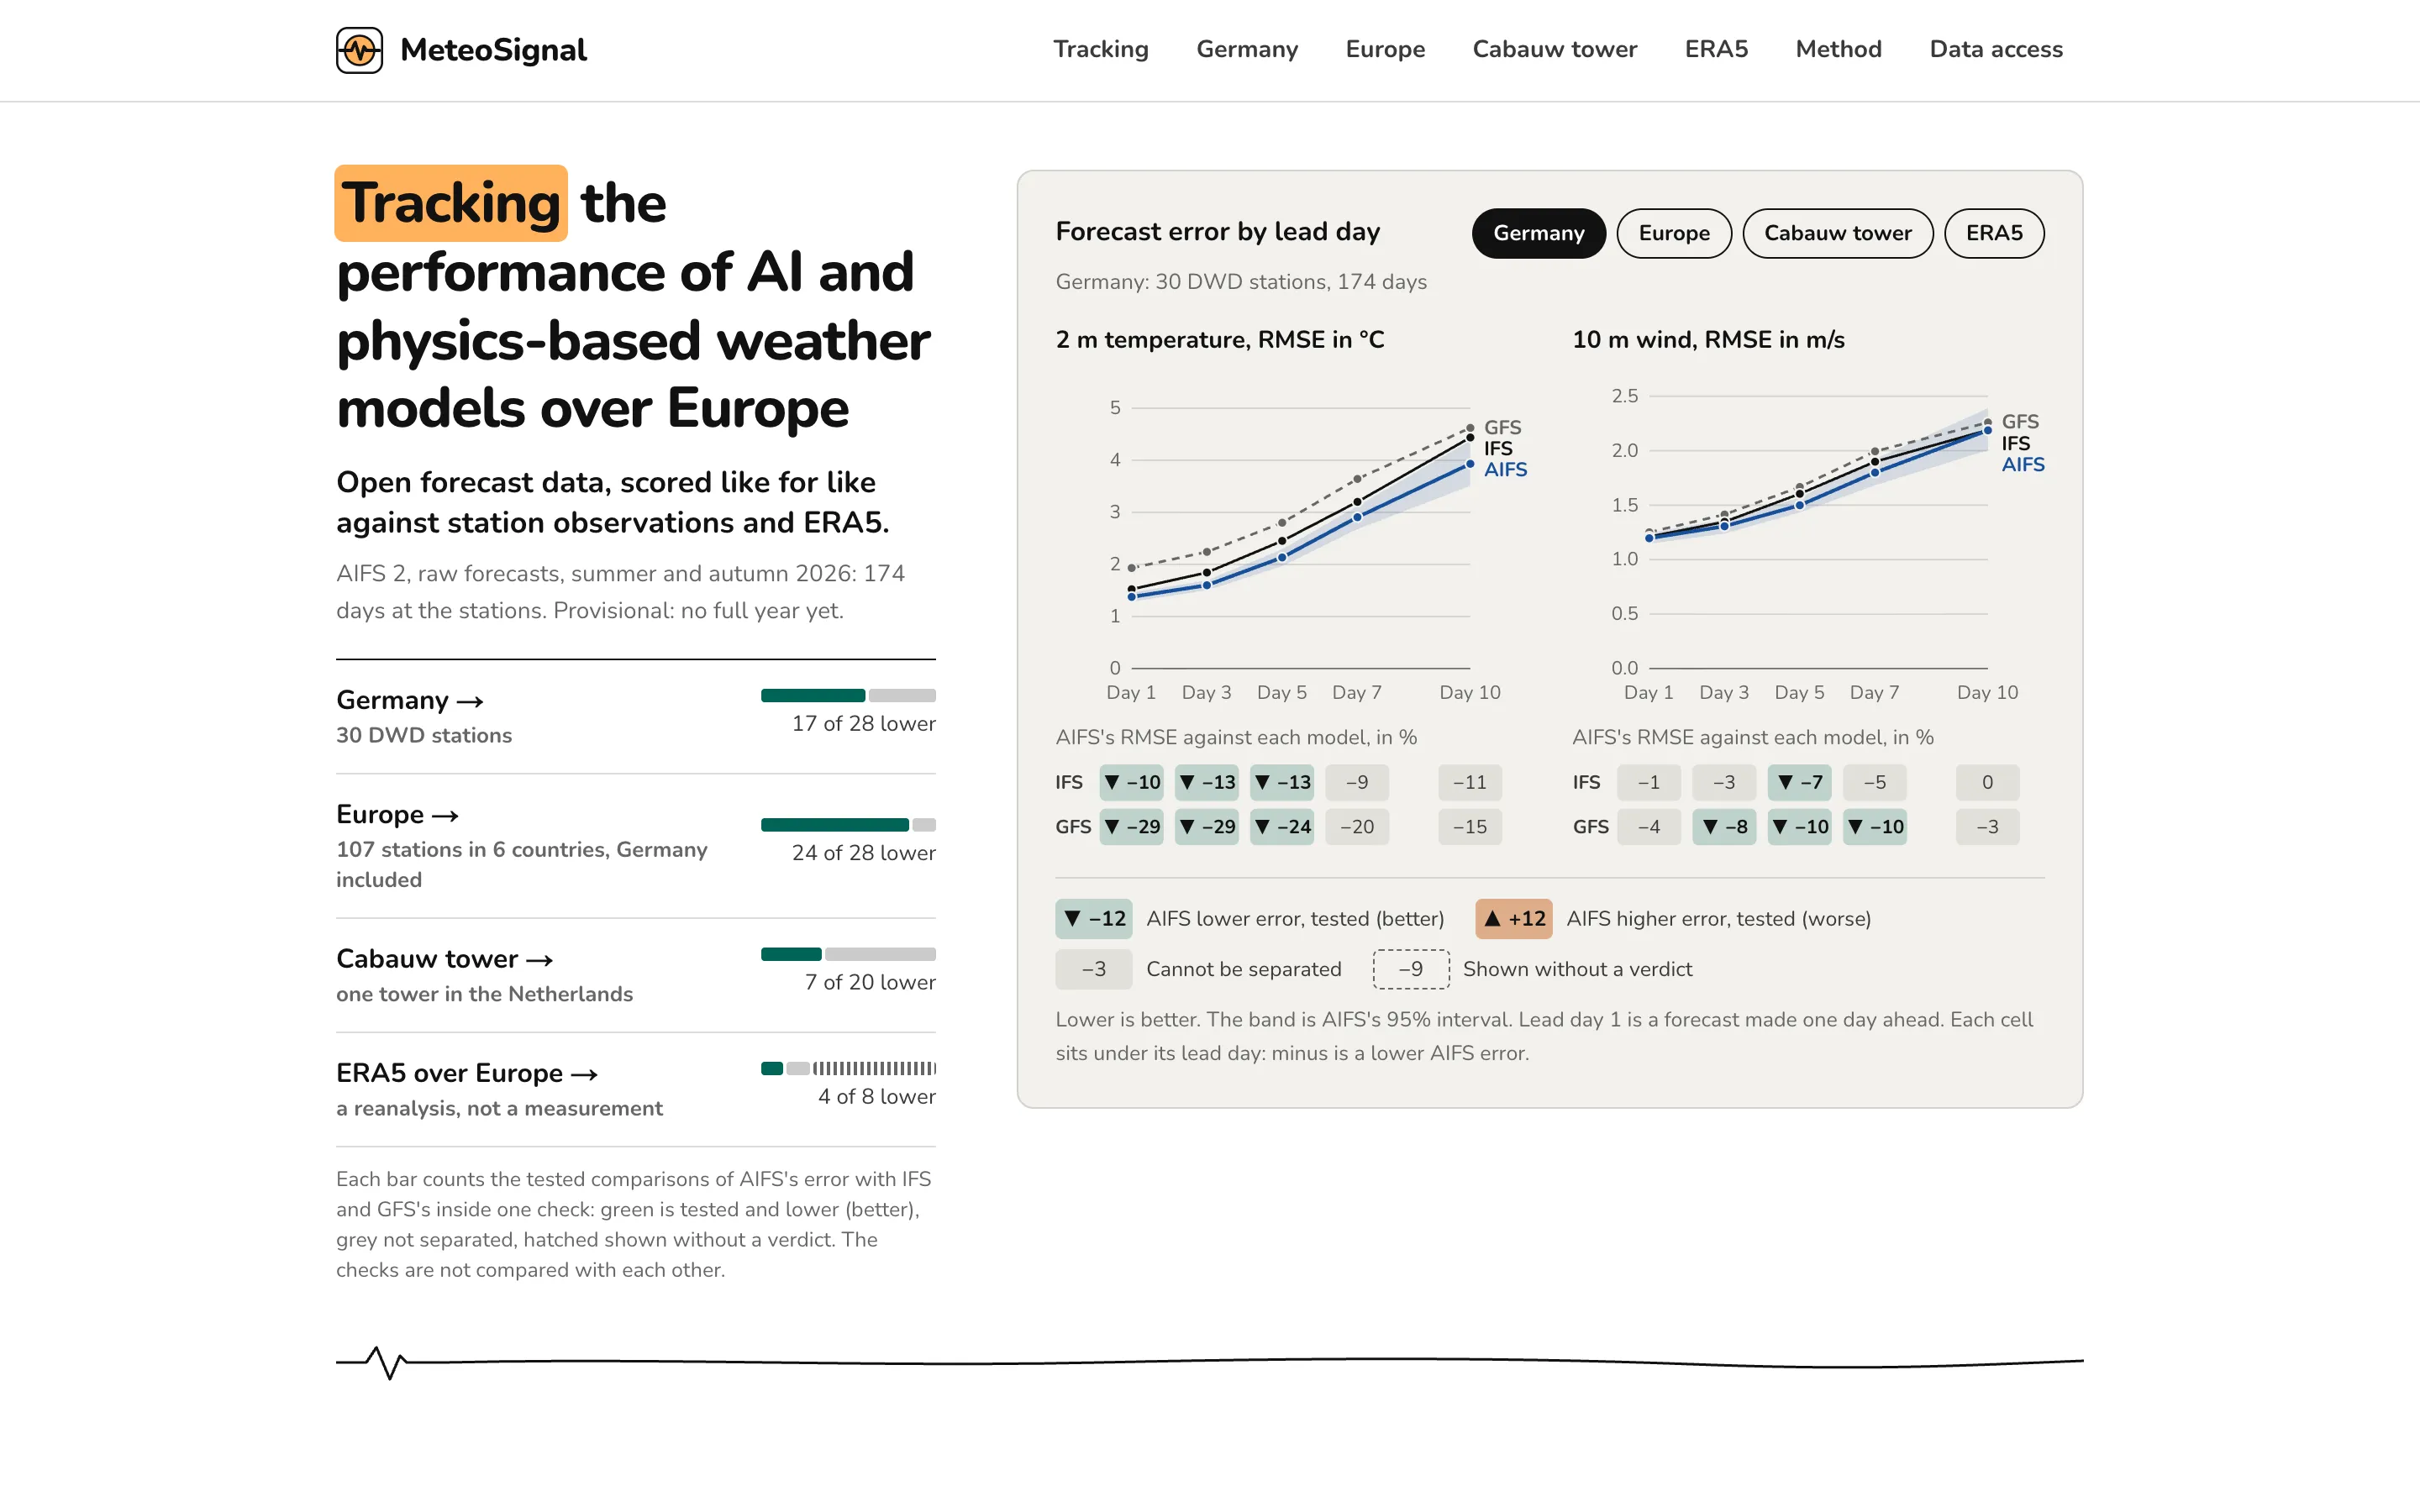
- At 30 German stations, over 174 days of summer and autumn 2026 (23 May to 12 November), AIFS’s error was lower in 17 of 28 tested comparisons with IFS and GFS, higher in none, and 11 could not be separated. Against ERA5 over Europe, for 500 hPa height over 171 days to 9 November, it was lower in 4 of 8 tested comparisons and higher in none.
- Everything is recomputed from open data every Monday, and the scores can be downloaded as files that an AI agent can read without guessing.
AI weather models arrive with a great deal of hype, and with more claims, leaderboards and announcements than anyone can follow. I wanted an answer I could check myself: not the model builders’ own scores, but open forecasts against open measurements at real weather stations, recomputed every week, with a statistical test before any difference counts. For anyone who relies on forecasts, in energy or elsewhere, that is the question that matters: how does a forecast do where the weather is actually measured?
Why another verification?
AI weather models have moved fast. Since 2023, papers on Pangu-Weather, GraphCast and GenCast have reported lower errors, on most targets, than ECMWF’s physics-based forecasts (for GenCast, its ensemble), and in February 2025 ECMWF made its own AI model, AIFS, operational, running side by side with its physics-based IFS. Most of those comparisons were made by the model builders, and most were scored against reanalysis or analyses: estimates that blend observations with a forecast model.
Forecast users meet something else: a forecast for a place, compared with what a thermometer, an anemometer or a pyranometer measured there. Open data now make it possible to check that independently. ECMWF, NOAA and the national weather services publish forecasts and observations that anyone can download, so the same check can run every week, on the same days and places for every model.
What MeteoSignal tracks
MeteoSignal is independent: it is not affiliated with ECMWF, NOAA, DWD or any other organisation whose data appear on it. The main model it tracks is ECMWF’s AI model AIFS: every comparison on the site is made from it. Its reference points are the two physics-based global models, ECMWF’s IFS and NOAA’s GFS. AIFS versions are scored apart and never pooled: version 1.1, scored from September 2025, and version 2, which replaced it on 12 May 2026 and is scored from 23 May 2026. The headline results describe version 2.
MeteoSignal also scores five more AI models. Each is compared with AIFS on the days when both have forecasts:
- AIGFS, NOAA’s own operational AI model, which starts from the GFS analysis;
- GraphCast (Google DeepMind), FourCastNet v2 (NVIDIA), Pangu-Weather (Huawei) and Aurora (Microsoft), as re-run by NOAA from ECMWF’s analyses. The scores describe NOAA’s re-runs, not the developers’ own systems.
A model appears only if its forecasts are published routinely, free of charge and without an account. That rule leaves out, for now, systems such as Google’s WeatherNext 2, which needs an account, and models released only as code and weights. Two AI ensembles, ECMWF’s AIFS ENS and NOAA’s AIGEFS, are openly available but wait for ensemble scores, which the site does not compute yet.
Where, and against what
MeteoSignal checks forecasts one, three, five, seven and ten days ahead. Station measurements come first; ERA5 is a second view. Each check has its own places, days and tests, so the checks are not compared with one another.
- 30 DWD stations in Germany, the main result: 2 m temperature, 10 m wind and daily solar energy, against DWD’s observations. The stations were fixed before any forecast was downloaded.
- 107 stations in six countries, Germany included, with the measurements of the national services of Austria, the Netherlands, Denmark, Switzerland and Finland, pooled into one set.
- KNMI’s Cabauw tower in the Netherlands, a case study at one site: 2 m temperature and wind at 100 m, estimated from measurements at two heights.
- 61 further stations in 11 countries, from NOAA’s coarser hourly reports, kept as a set of their own.
- ERA5 over Europe, on a 0.25° grid from 35 to 72°N and 12.5°W to 40°E, sea included: 500 hPa height, 2 m temperature and 10 m wind.
The forecasts are decoded from the models’ original files and read the same way for every model, and temperature is moved to the station’s height before scoring.
How a difference becomes a result
Two models rarely have exactly the same error, and over a few weeks one of them will look better by chance. MeteoSignal therefore calls a difference only when it passes every rule:
- every comparison is paired: AIFS and one other model, at the same times and places, and only AIFS is tested against the others;
- the difference’s 95 % interval, from a block bootstrap over forecast dates, must exclude zero, its Holm-adjusted p-value must be below 0.01, and the sample must hold at least 15 blocks of at least 10 days each, so at least 150 days;
- the difference must have the same sign in the first and second half of the period;
- at the stations it must also hold when the models are read at the nearest land point instead of by interpolation, and a temperature result must also hold with a different height correction.
Otherwise the site says the two models cannot be separated: no clear difference, too few days, or a difference that depended on how the station was read or on the height correction. It does not mean they were equal.
The test is repeated at every weekly update, and a test repeated like that gives a false verdict more often than its level says. That is why the bar is set higher than usual: since 16 November 2026 a verdict needs a p-value below 0.01, where it used to need 0.05. Every verdict stays interim until an AIFS version has been scored over a full year and every season, and AIFS 2’s sample so far covers summer and autumn 2026.
At the stations
The headline results are for AIFS 2 and its raw forecasts, from 23 May to 12 November 2026 (174 days). No tested comparison in any station set went against AIFS 2.
- 30 German stations: AIFS’s error was lower in 17 of 28 tested comparisons with IFS and GFS, higher in none, and could not be separated in 11. Three days ahead, its 2 m temperature error was 13 % lower than IFS’s and 29 % lower than GFS’s (both tested). Its 10 m wind error was 3 % lower than IFS’s, which the tests could not separate, and 8 % lower than GFS’s (tested).
- 107 stations in six countries: lower in 24 of 28 tested comparisons, higher in none, not separated in 4 (174 days; solar energy 173). Three days ahead, AIFS’s temperature error was 12 % lower than IFS’s and its wind error 5 % lower (both tested).
- The Cabauw tower: lower in 7 of 20 tested comparisons, higher in none, not separated in 13. For 2 m temperature, over 172 days to 12 November, AIFS’s error was 45 %, 39 % and 32 % lower than GFS’s one, three and five days ahead (tested); against IFS it was 12 % to 16 % lower at those leads, which the tests could not separate. For wind at 100 m, over 174 days, its error was lower than GFS’s at every lead except seven days ahead (tested), and could not be separated from IFS’s at any lead. Part of the tower record has not yet been validated by KNMI, so these results may change.
- The 61 NOAA stations: only 101 days for temperature (23 May to 10 November 2026) and 94 for wind (to 9 November) are available, too few for a verdict.
Solar energy. Daily solar energy is scored at the German and European stations. In Germany, three days ahead, AIFS’s error was 16 % lower than IFS’s and 29 % lower than GFS’s (both tested). IFS is scored only up to five days ahead, because its 06:00 and 18:00 UTC runs stop at day 6.
Against a simple guess. Skill is the share by which a model’s error is below that of climatology (the average for that date and hour) or persistence (the latest measurement carried forward). It is measured with an interval, not tested. At the German stations, three days ahead, AIFS’s error was 61 % below climatology’s for 2 m temperature, 24 % for 10 m wind and 47 % for solar energy. Seven days ahead, its temperature error was still 29 % below climatology’s, while its wind error could no longer be told apart from climatology’s: wind is harder to forecast far ahead. The station climatology (2015 to 2024) is not adjusted for warming and ran 0.9 K too cold over these days, which raises every model’s temperature skill against it.
Raw and bias-corrected forecasts. The headline scores forecasts as issued. A second track first removes each series’ average error over the previous 30 days, for IFS and GFS as for AIFS. That track starts on 22 June 2026, so its sample at the German stations, 144 days for temperature and wind and 143 for solar energy, is still too short for a verdict, and every corrected AIFS 2 comparison shows “cannot be separated” for now.
Smoothness. RMSE rewards smooth forecasts, so the site reports how much each model varies alongside its error. Three days ahead at the German stations, AIFS 2’s temperature forecasts carried 97 % of the measured variability around climatology, against 94 % for both physics models, and its wind forecasts 89 %, against 94 % to 98 % (100 % would match the measured variability; these values are not tested). So AIFS’s temperature forecasts came closest to the measured variability, while its wind forecasts were the smoothest of the three, which flatters its wind RMSE.
Against ERA5
ERA5 is ECMWF’s reanalysis: a reconstruction of the atmosphere that blends decades of observations with a forecast model. MeteoSignal uses it as a second view over a frame covering most of Europe, sea included, and not as a measurement: AIFS was trained mostly on ERA5, which probably favours it.
Verdicts are given only for 500 hPa geopotential height, the mid-level pressure pattern that steers weather systems, and never one day ahead, when the models start from different analyses and ERA5 is itself an ECMWF product. Over 171 days, from 23 May to 9 November 2026, AIFS 2’s error was:
- 8 % lower than IFS’s three days ahead and 14 % lower five days ahead (tested); seven and ten days ahead, the two could not be separated;
- 32 % lower than GFS’s three days ahead and 19 % lower seven days ahead (tested); five and ten days ahead, the two could not be separated.
For 2 m temperature and 10 m wind against ERA5 (171 days each, to 9 November), the differences are shown without a verdict at any lead: each model’s temperature refers to its own terrain height, IFS starts from its own analysis, and AIFS was trained on ERA5. One day ahead, AIFS’s error in these variables was lower than IFS’s by a much larger share against ERA5 than at the stations (not tested), and the site advises taking the size of any short-range advantage from the station results.
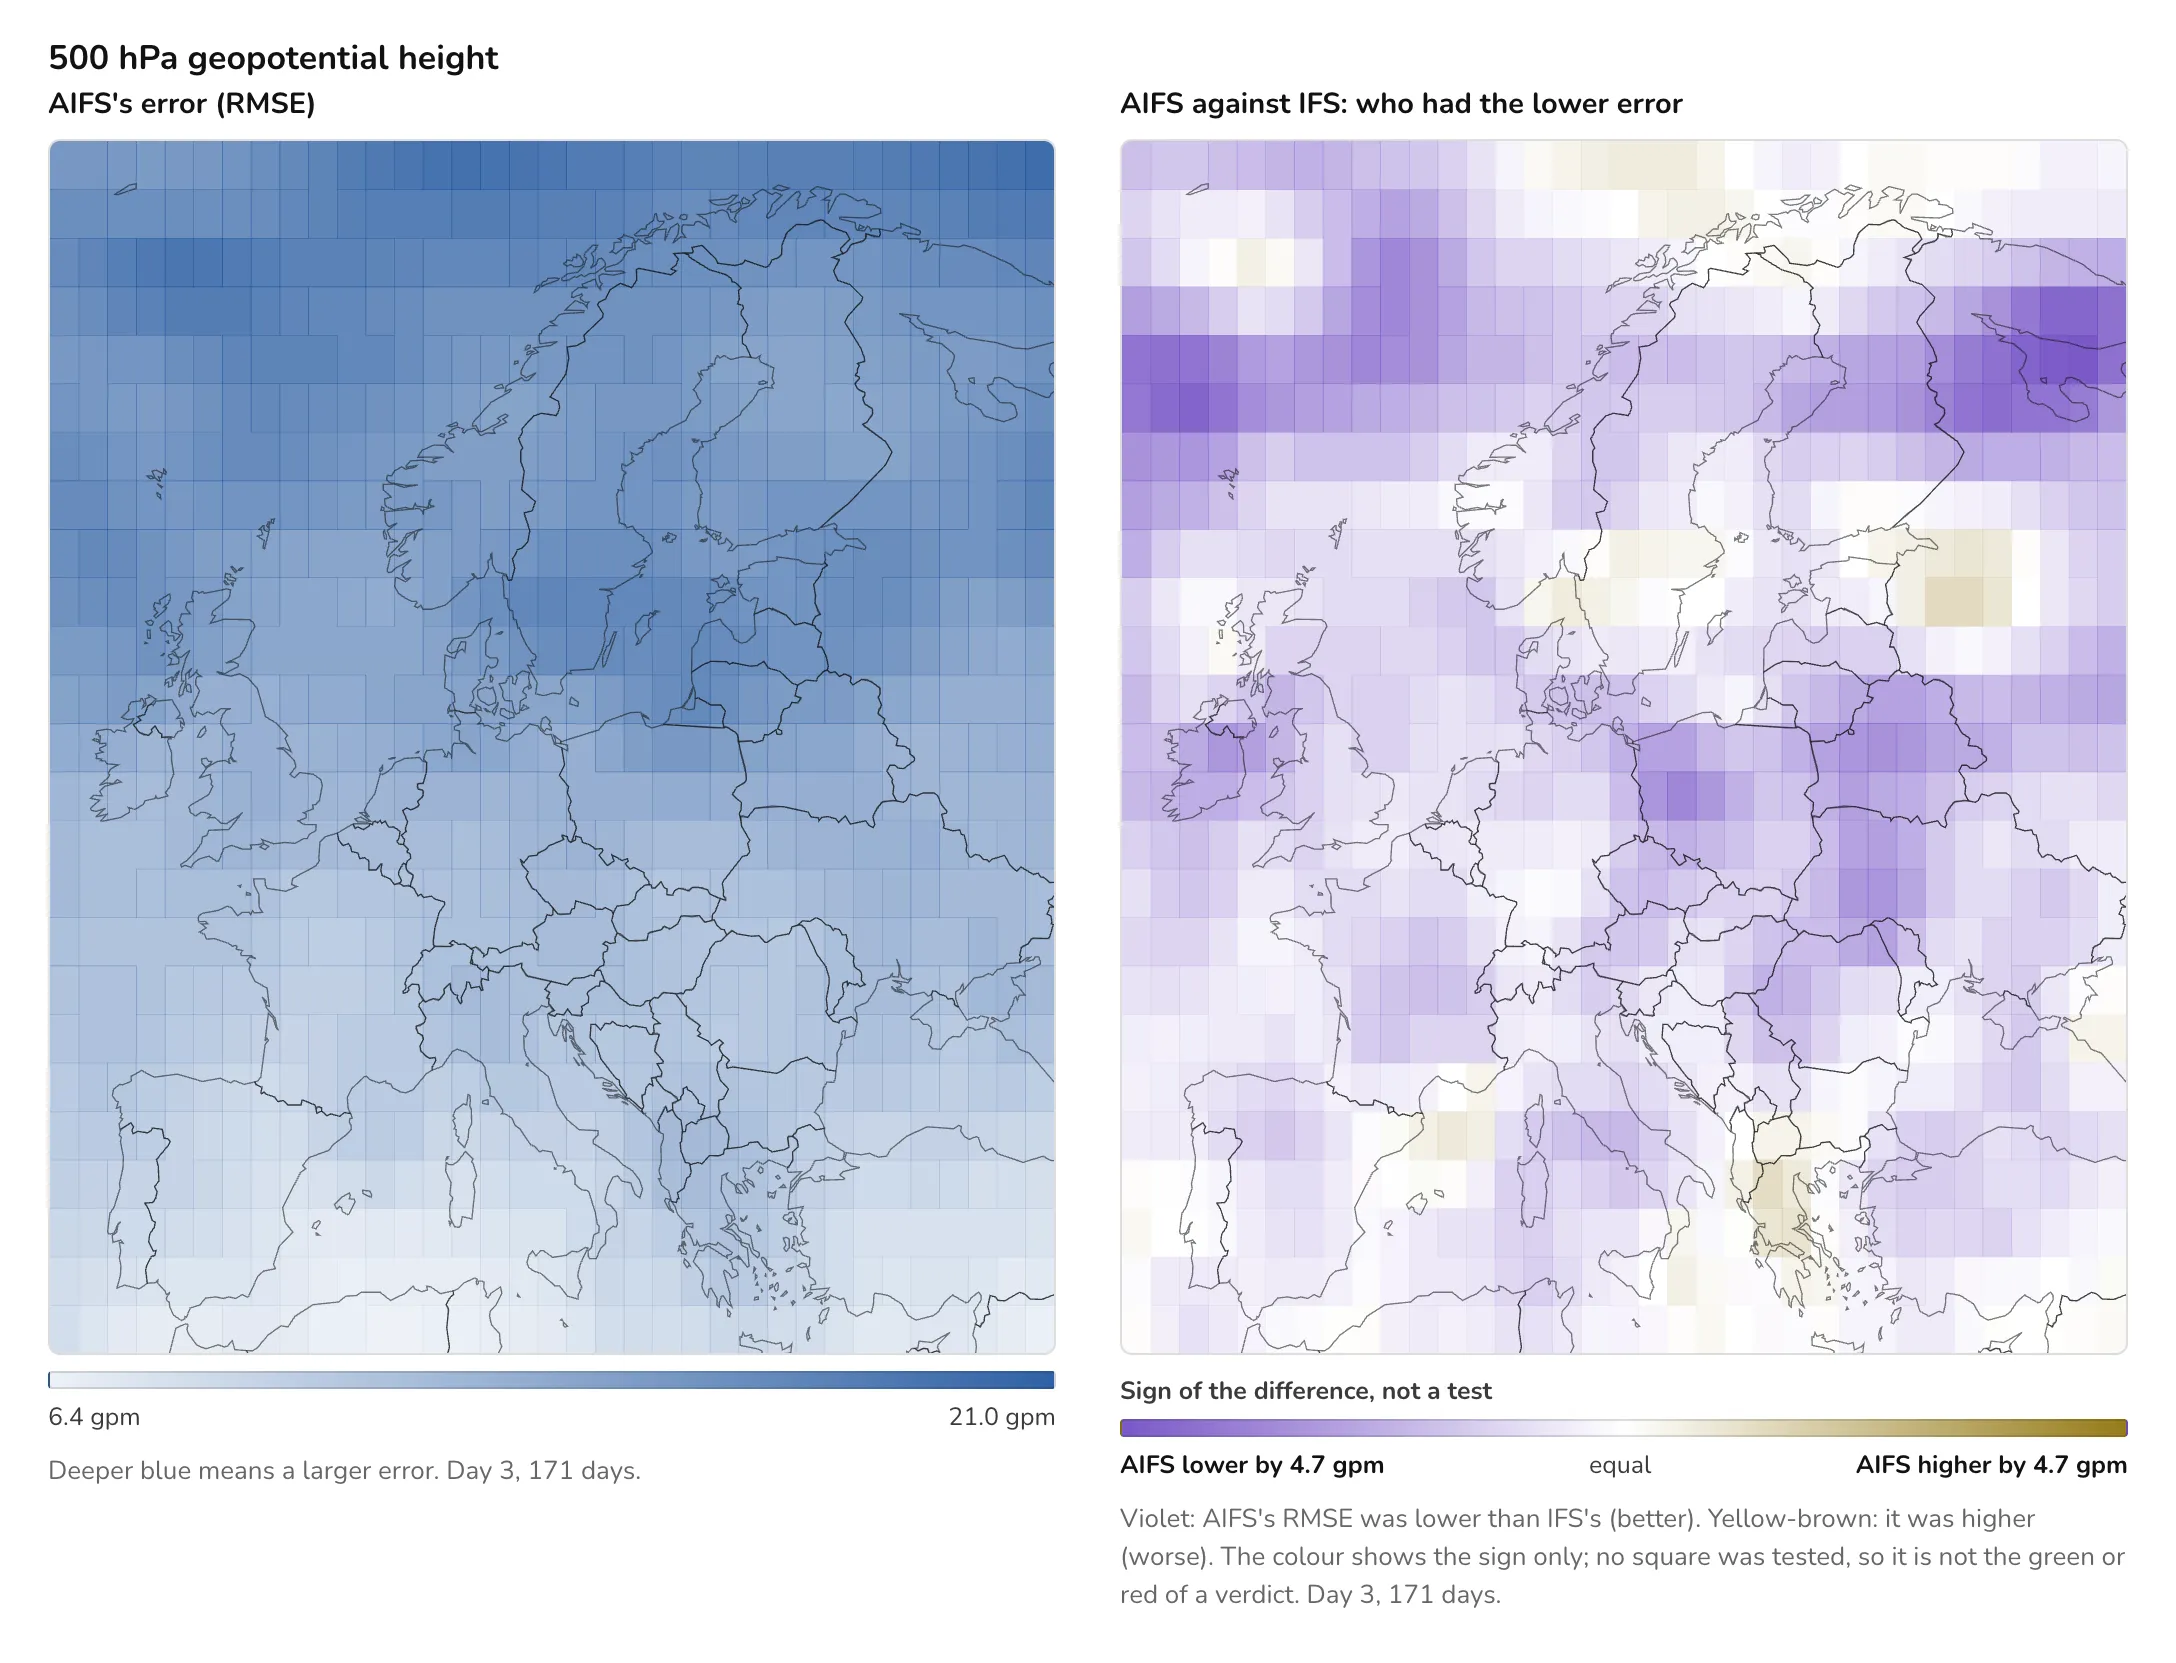
Where the error sat, three days ahead, over 171 days: AIFS’s error against ERA5 (left), and whether it was lower than IFS’s (violet, better) or higher (yellow-brown, worse). The colours show a pattern only; no square was tested.
The other AI models
- AIGFS, in a set of its own with AIFS on the days both have forecasts (156 days, 23 May to 4 November 2026, German stations): AIFS’s 2 m temperature error was 16 %, 16 % and 13 % lower one, three and five days ahead (tested), and could not be separated from AIGFS’s seven and ten days ahead; its 10 m wind error could not be separated from AIGFS’s at any lead. Against ERA5 at 500 hPa, over 166 days from 23 May to 4 November 2026, AIFS’s error was 29 % and 23 % lower than AIGFS’s three and five days ahead (tested).
- GraphCast, FourCastNet v2, Pangu-Weather and Aurora, in the panel of all AI models (68 days at the German stations, 21 July to 4 November 2026, and 108 days against ERA5, 20 July to 4 November): the sample is still too short for a verdict, so every comparison at the stations, and every 500 hPa comparison from three days ahead against ERA5, shows “cannot be separated”; the rest against ERA5 are shown without a verdict. The untested values are on the site for orientation only.
Only one tested result anywhere on the site has gone against AIFS, and it comes from the earlier version, AIFS 1.1, not from AIFS 2: against ERA5 at 500 hPa, ten days ahead, AIFS 1.1’s error was 13 % higher than that of NOAA’s re-run of Aurora (worse; 241 days, 7 September 2025 to 11 May 2026).
Month by month
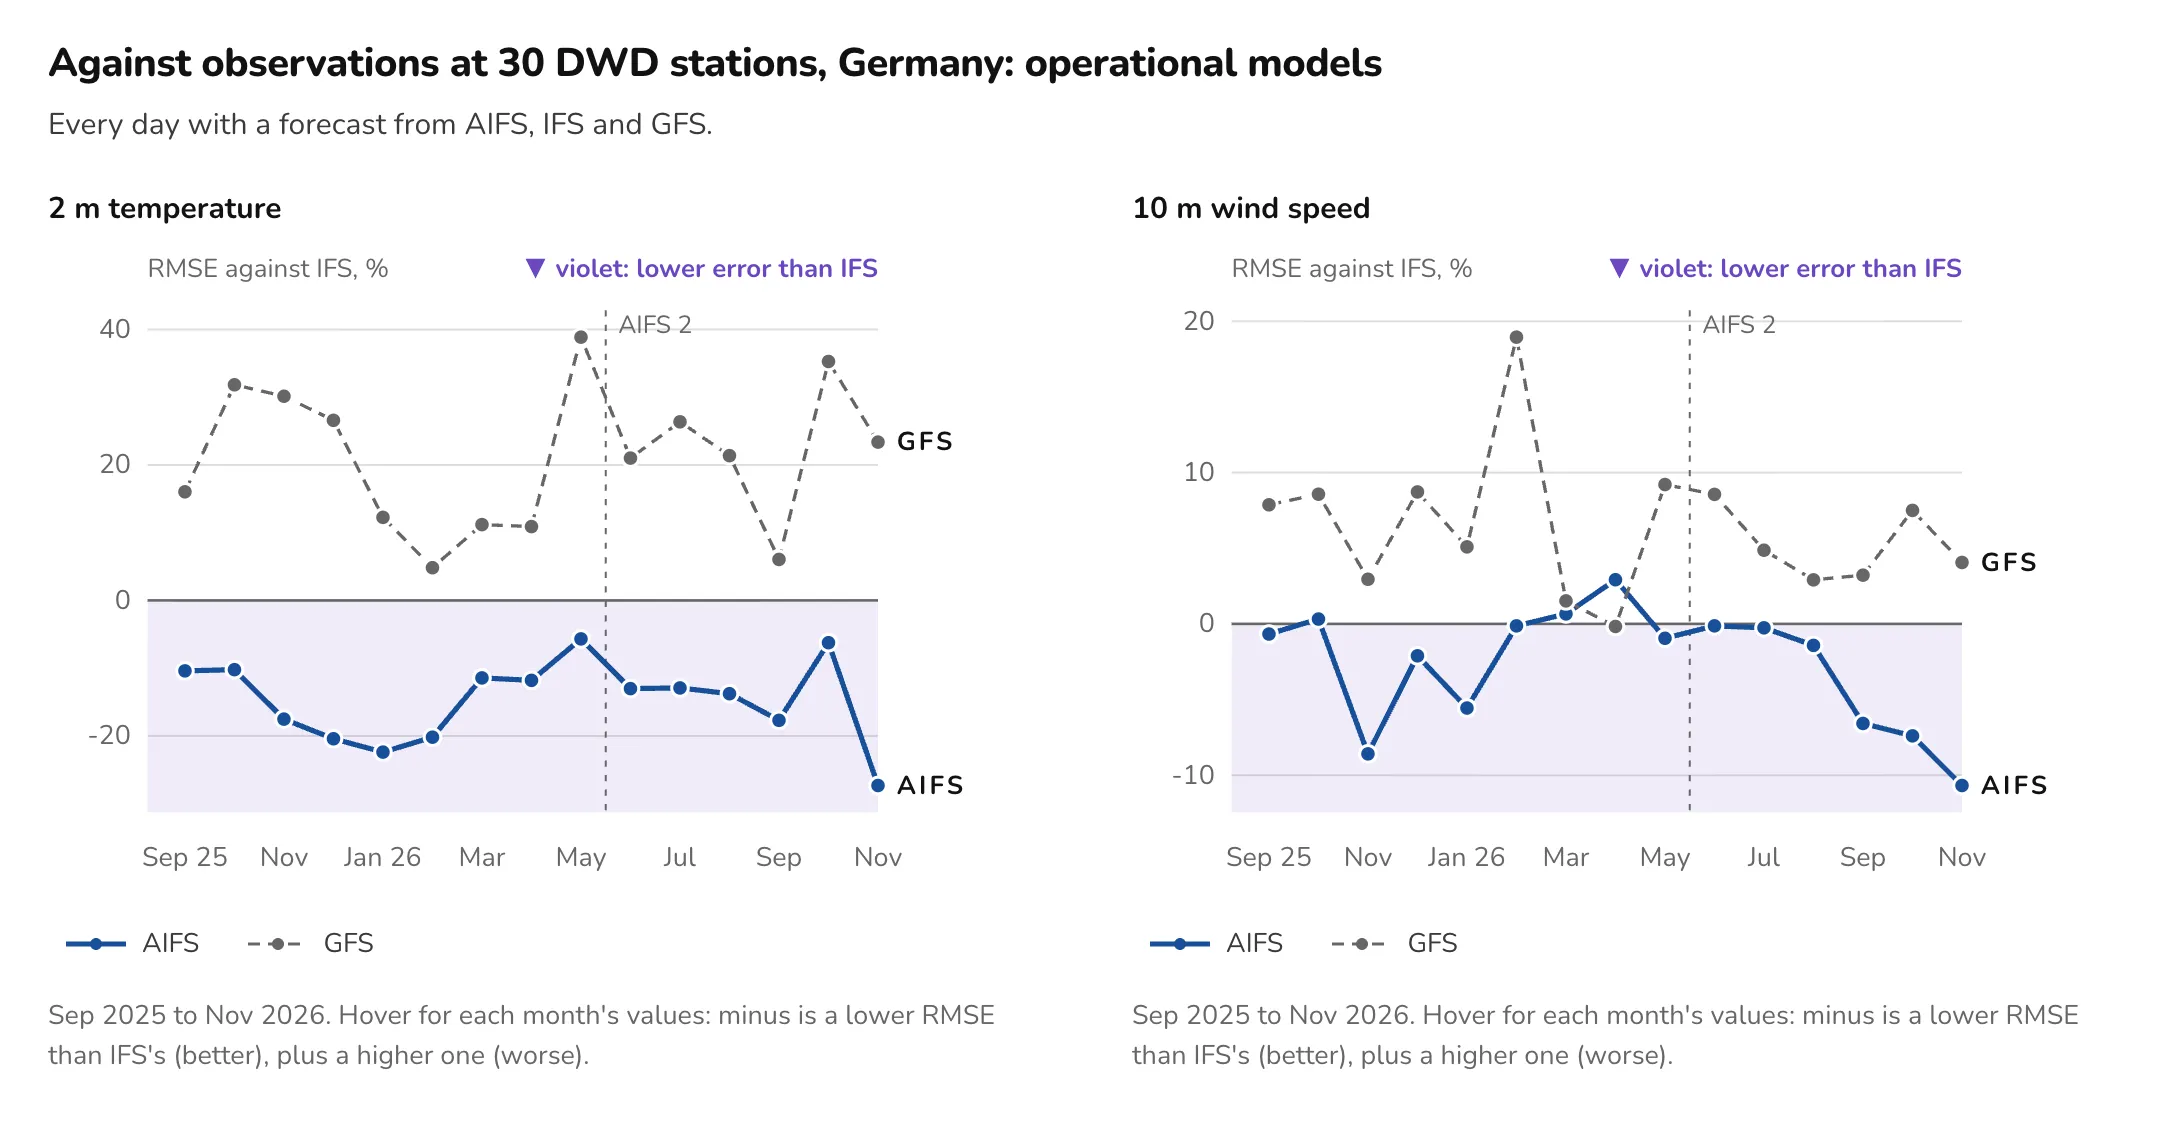
Month by month at the German stations, three days ahead, to November 2026, which holds only its first 12 days so far. The AIFS line shows AIFS 1.1 up to May 2026 and AIFS 2 from June (dotted line). Below the zero line, on the violet side, a model had a lower error than IFS that month (better). Monthly values are not tested.
The tracking page shows how each model’s error moves with the season and with model versions, at the German and European stations and against ERA5. The weekly update adds the new days, so the current month fills up week by week.
Data ready for people and for AI agents
The results are not only charts. The data access page offers four CSV files: the scores at the stations and the tower, AIFS against each other model at the stations and the tower, the scores against ERA5, and AIFS against each other model against ERA5. Every row carries its unit, its sample and the data version, so a row still makes sense when it is copied somewhere else.
With them comes a description in the open Frictionless Data Package format: every column with its type, unit and allowed values, and the rules for reading the numbers. Point an AI agent at it and it can load the data and answer questions without guessing. The page also has a ready prompt to paste into an agent; it tells the agent to treat a difference as a finding only when the test says so, to give every number with its sample, and to keep the credit with the results.
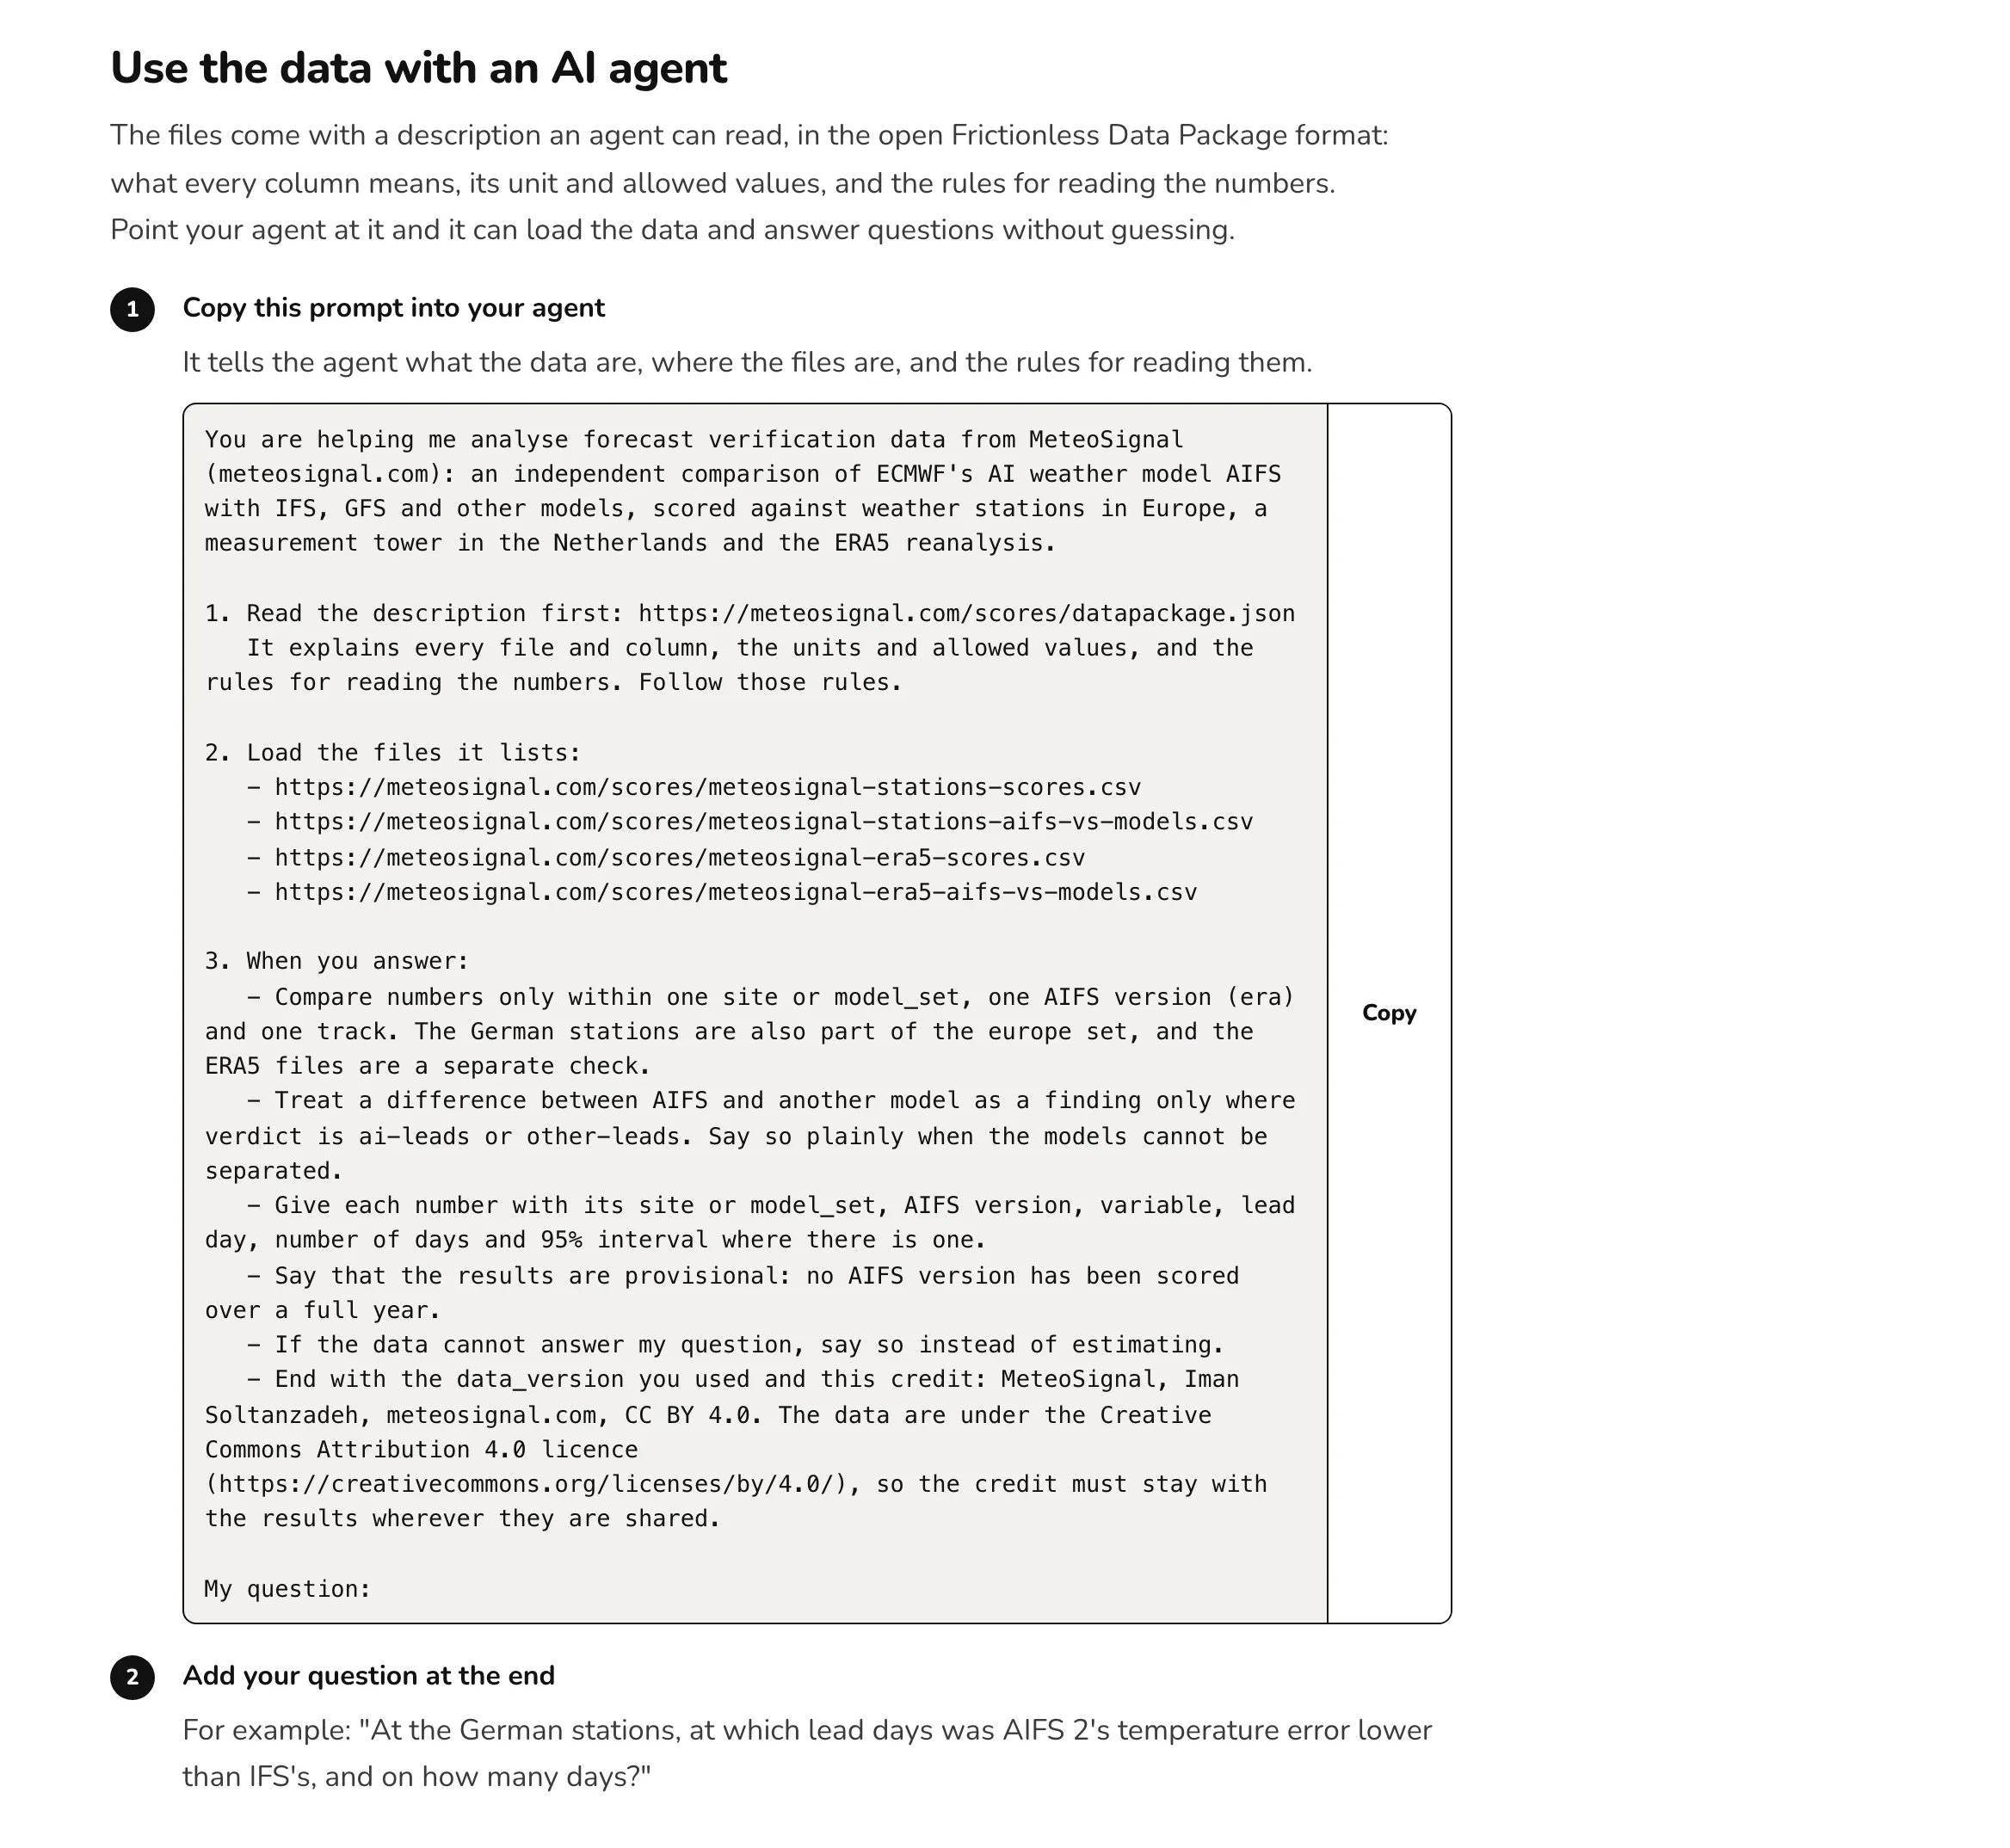
A prompt for any AI agent, on the data access page.
A short guide for language models (llms.txt) and every headline result as plain text (results.md) sit beside the files, and for readers in a hurry there is a summary sheet that prints on two A4 pages.
What the numbers cannot show yet
- Skill across a full year: no AIFS version has one yet, and AIFS 2 has no winter or spring so far.
- Whether one AIFS version has a lower error than the other: they cover different seasons.
- Skill in storms, ramps or other extremes: RMSE averages over every day and says little about extremes, although each page also has bias and activity tables, and the station pages have event tables.
- Skill elsewhere: the German result covers 30 stations, 9 of them in Bavaria, weighted equally, and these are weather stations and one tower, not wind or solar farms.
- Scores on final measurements: DWD’s observations from January 2026 onwards are still provisional.
What comes next
- Winter is the next test. Every result stays provisional until an AIFS version has been scored over a full year.
- DWD’s ICON and its AI version AICON have been collected from DWD’s own files every six hours since 8 November 2026, for a new series once the sample is long enough.
- The panel of all AI models needs at least 150 days before it can give a verdict.
- Here on this site, I plan a regular wrap-up, about once a month: what the latest month showed, and what the whole sample says. MeteoSignal itself updates every Monday, and its method page sets out every rule, source and credit.
If you research AI weather models, the data package and the ready prompt let you, or your AI agent, ask your own questions of the scores, with the samples and the tests attached.
Sources
- Forecasts: AIFS and IFS from ECMWF open data, CC BY 4.0; GFS and AIGFS from NOAA/NCEP; GraphCast, FourCastNet, Pangu-Weather and Aurora from the AI Weather Prediction Model Reforecasts of CIRA and NOAA GSL (Radford et al. 2025).
- Measurements: Deutscher Wetterdienst, GeoSphere Austria, the Danish Meteorological Institute, KNMI, MeteoSwiss and the Finnish Meteorological Institute, all CC BY 4.0; NOAA’s Global Historical Climatology Network hourly.
- Reanalysis: ERA5 from the Copernicus Climate Change Service (Hersbach et al. 2020).
- Models: AIFS (Lang et al. 2024), GraphCast (Lam et al. 2023), FourCastNet v2 (Bonev et al. 2023), Pangu-Weather (Bi et al. 2023) and Aurora (Bodnar et al. 2025).
- Cite MeteoSignal as: Soltanzadeh, I. (2026). MeteoSignal: verification of open weather forecasts over Europe. Data version 16 November 2026, run 20261116T194902Z. https://meteosignal.com/
Results: MeteoSignal, Iman Soltanzadeh, meteosignal.com, data version 16 November 2026, under Creative Commons Attribution 4.0.
The views in this article are my own and do not represent those of my employer or of any organisation I am associated with.
New articles by email
A short brief whenever I publish.
The key points of each new article and a link to read it in full, about once a month. No tracking; unsubscribe at any time.
You’ll get a confirmation link first. See the privacy notice.
